A ticket lands: "The portal is down." The user is in Nakawa, the app server is a Linux VM, and the Windows-only habits many new graduates bring from campus labs do not help much. I see this every year when MUBS Applied Computing students start industrial training, and when Nkumba classes meet their first production-like Linux box. You do not need five hundred commands. You need a short triage order and about fifteen tools you can run without guessing.
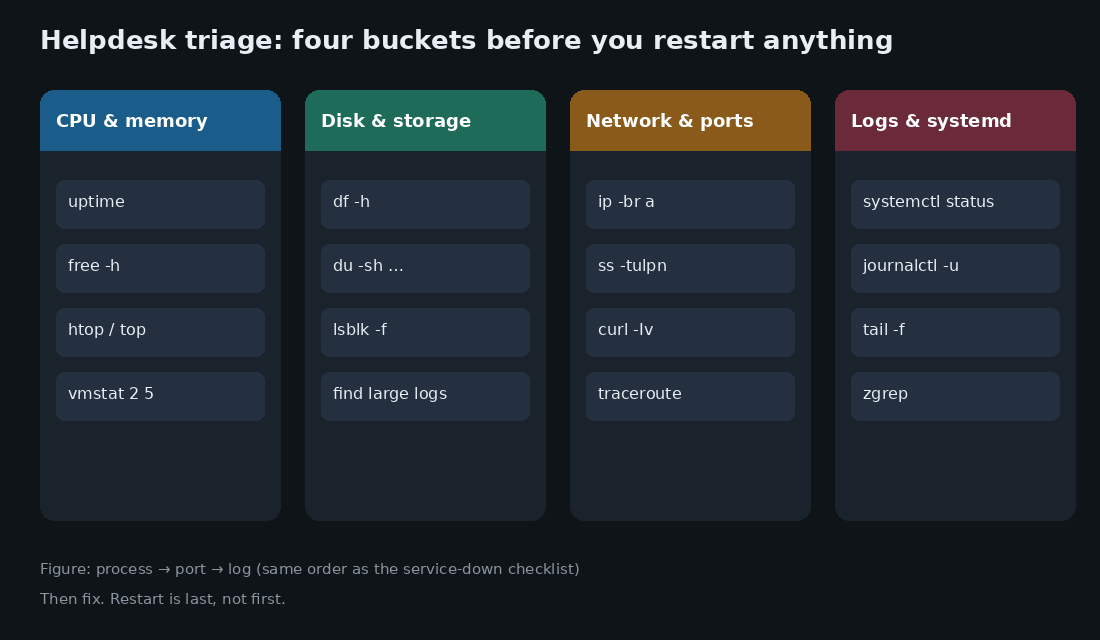
The order I teach is the same order I use on consulting calls: resource pressure first, disk second, network and ports third, then logs and systemd. Restart is last. If you restart first you throw away the only stack trace you had. That idea is expanded in Linux service down? Check the process, port, and logs first.
1. CPU and memory: is the box simply drowning?
Before you blame nginx, ask whether the machine has room to think.
# Load averages for 1, 5, and 15 minutes, plus uptime
uptime

# Memory in human units
free -h

# Interactive process view (install if missing: sudo apt install htop)
htop
# or the classic
top

# Virtual memory and run-queue snapshot every 2 seconds, five times
vmstat 2 5
How I read uptime in class: compare the load average to the number of CPUs (nproc). A load of 8 on a 2-vCPU cloud instance is a queue. A load of 0.2 on the same box means look elsewhere. With free -h, watch the available column on modern Ubuntu, not only the cached line students love to misread.
When htop shows one Python process eating a full core, do not kill -9 yet. Note the PID, the user, the start time, and whether it is a runaway script from a cron job. On one Kampala client site the "down" portal was a stuck batch job pinning CPU while the web workers starved. Restarting nginx alone did nothing until we stopped the batch.
2. Disk and storage: silent full disks look like random failure
A full root filesystem is the most common "mysterious" outage I meet in small offices. Databases refuse writes. systemd cannot write journals. SSH can even misbehave when it cannot create temporary files.
# Free space on mounted filesystems
df -h

# Inodes can be exhausted even when bytes remain
df -hi

# Top space users under /var/log (adjust path as needed)
sudo du -ah /var/log 2>/dev/null | sort -rh | head -n 15

# Block devices, filesystems, mount points
lsblk -f
Classroom drill I run at MUBS: fill a disposable VM with a huge log, watch a demo app fail with a useless message, then recover with df and du. Students never forget that lesson. Also check inode exhaustion with df -hi when someone created millions of tiny session files.
# Find the largest directories one level under /
sudo du -h --max-depth=1 / 2>/dev/null | sort -rh | head
If /var/log is the villain, rotate or truncate carefully. Prefer fixing the noisy service to deleting evidence you may need for an incident note. Auditors care about that distinction; see Phase 2 of an IS Audit: Fieldwork and Evidence.
3. Network and ports: can anything reach the service?
Users say "the network is down" when they mean "my URL times out." Separate link problems from listening-socket problems.
# Brief view of addresses and interface state
ip -br a

# All listening TCP/UDP sockets with process names
sudo ss -tulpn

# Old habit many guides still show; ss is preferred on modern Ubuntu
# sudo netstat -tulpn

# HTTP headers and TLS handshake without a browser
curl -Iv https://127.0.0.1/
curl -Iv https://portal.example.co.ug/

# Where do packets stop? (install traceroute if needed)
traceroute 8.8.8.8
# or
tracepath 8.8.8.8
Read ss -tulpn like a checklist: is nginx on 0.0.0.0:443 or only on 127.0.0.1:443? Is the process name what you expect? I have watched students debug "firewall issues" for an hour when the app was bound to localhost after a config typo.
For the man page concepts behind these tools, Ubuntu documents them clearly, for example ss(8) and free(1).
If the hop-by-hop path looks wrong across routers, your problem may be routing rather than the app. The two-way static route failure mode is documented here: Cisco Static Route Not Working? Fix the Missing Return Route.
4. Logs and systemd: ask the service what hurt
# Unit state, main PID, and recent lines
systemctl status nginx.service --no-pager

# Follow this unit's journal
journalctl -u nginx.service -f -n 50

# Broader window since boot
journalctl -u nginx.service -b --no-pager | tail -n 100

# Classic file follow for apps that still log to /var/log
sudo tail -n 50 -f /var/log/nginx/error.log

# Search rotated, compressed logs
sudo zgrep -i "emerg\|alert\|crit" /var/log/nginx/error.log* 2>/dev/null | tail
I mark students down when they paste restart before status. Status tells you if the unit is failing in a loop (look for activating (auto-restart)). Journalctl tells you the exception. Tail tells you what the app thought. Together they usually name the broken config line.
# Is the unit enabled to survive reboot?
systemctl is-enabled nginx.service

# Recent failed units on the box
systemctl --failed
A fifteen-command pocket card (grouped)
Here is the same toolkit as a single card you can keep in your notebook:
uptimefree -hhtoportopvmstat 2 5df -hdf -hisudo du -ah /var/log | sort -rh | headlsblk -fip -br asudo ss -tulpncurl -Iv URLtracerouteortracepathsystemctl status UNITjournalctl -u UNIT -n 50sudo tail -f /path/to/app.log
Bonus when you need it: zgrep across rotated logs, and systemctl --failed for a quick farm-wide hint on one host.
A real ticket walkthrough (short)
User: "API returns 502." You SSH in.
uptimeandfree -hlook fine.df -hshows/at 100%.dufinds/var/log/nginx/access.logat 40G because rotation was never configured.You rotate/truncate with care, free space returns, workers can write again.
You fix logrotate, document the change, and only then confirm
curl -Ivthrough the proxy.
No mystical tuning. Just the card above, in order.
Habits that separate helpdesk from guessing
Write the commands you ran in the ticket. Future you will need them at 02:00.
Change one thing at a time. If you restart three units and edit a config, you learned nothing.
Copy exact errors, not paraphrases. "It failed" is not evidence.
Know when to escalate: repeated OOM kills, storage array alarms, or routing that leaves your LAN may need a senior or a network engineer.
Key takeaways
Most Linux helpdesk work clusters into CPU/memory, disk, ports, and logs.
df -hearly saves hours of false leads.ss -tulpnconfirms the process you think is listening really is.systemctl statusplusjournalctlbeats blind restarts.Practice the card on a lab VM until your hands type it without opening notes.
Master these fifteen well and you will close more tickets than classmates who memorised obscure one-liners they never use. The goal is not to look clever on the terminal. The goal is to restore service with evidence, then leave the box healthier than you found it.