A SACCO operations manager drops a USB stick on the desk: three CSV exports from different branches, date formats that disagree, currency symbols in the amount column, and duplicate receipt IDs. She needs a clean daily summary by tomorrow morning for the board pack. That is not a machine learning problem. That is a pipeline problem.
I teach data handling to computing students at MUBS and Nkumba, and I build the same kind of extract-transform-load (ETL) jobs in consulting around Kampala. This walkthrough builds a first pandas pipeline you can finish today, loads results into SQLite, and shows how to check your work before anyone trusts the chart.
What a beginner pipeline actually does
ETL sounds corporate. In practice you:
Extract raw rows from CSV, Excel, or an API.
Transform types, fix nulls, drop duplicates, normalise categories.
Load into a database or a clean file that analysts can query.
Python’s pandas library is the usual starting toolkit. Official entry points include pandas.read_csv and the broader I/O tools user guide. Learn those pages; blog posts go stale, the docs stay authoritative.
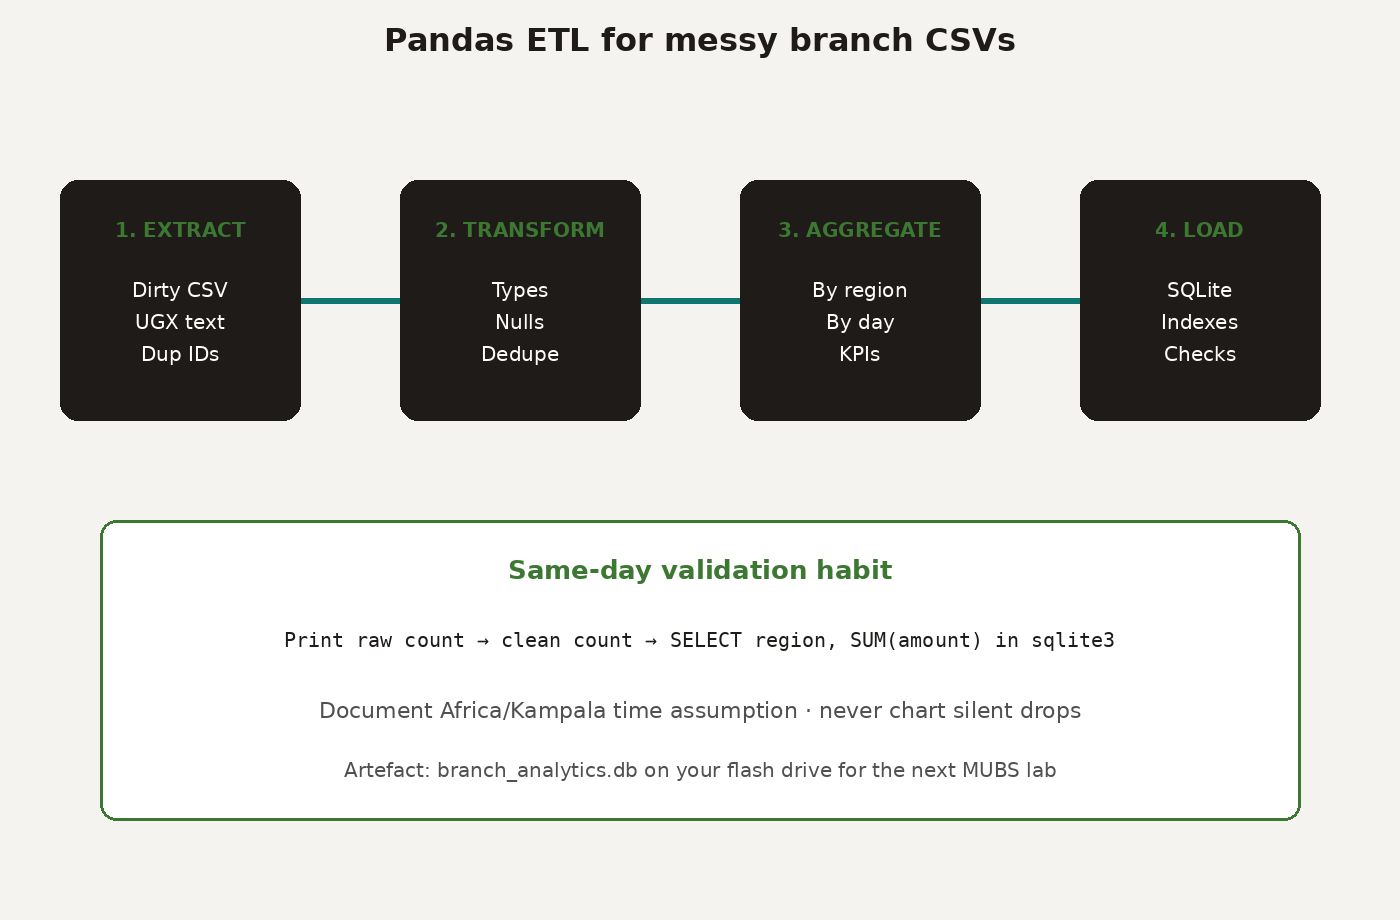
Scenario and sample raw file
Imagine branch_transactions_raw.csv with columns: transaction_id, timestamp, amount, region, product. Some amounts look like UGX 15,000. Some timestamps are empty. Some transaction IDs repeat because a teller exported twice.
Create a tiny sample by hand if you lack a real export. Twelve messy rows beat a perfect textbook file.
Worked example: extract, transform, load
import sqlite3
from pathlib import Path
import pandas as pd

def extract_data(csv_file: Path) -> pd.DataFrame:
    print(f"[*] Extracting {csv_file}")
    df = pd.read_csv(csv_file)
    print(f" Raw rows: {len(df)}")
    return df

def transform_data(df: pd.DataFrame) -> pd.DataFrame:
    print("[*] Transforming...")
    df = df.drop_duplicates(subset=["transaction_id"]).copy()

    df["timestamp"] = pd.to_datetime(df["timestamp"], errors="coerce")
    df = df.dropna(subset=["timestamp"])

    if df["amount"].dtype == object:
        cleaned = (
            df["amount"]
            .astype(str)
            .str.replace("UGX", "", regex=False)
            .str.replace(",", "", regex=False)
            .str.strip()
        )
        df["amount"] = pd.to_numeric(cleaned, errors="coerce")

    df = df.dropna(subset=["amount"])
    df = df[df["amount"] > 0]
    df["region"] = df["region"].fillna("UNKNOWN").astype(str).str.strip().str.upper()

    print(f" Clean rows: {len(df)}")
    return df

def load_data(df: pd.DataFrame, db_path: Path) -> None:
    print(f"[*] Loading into {db_path}")
    conn = sqlite3.connect(db_path)
    df.to_sql("fact_transactions", conn, if_exists="replace", index=False)
    with conn:
        conn.execute(
            "CREATE INDEX IF NOT EXISTS idx_trans_time ON fact_transactions(timestamp);"
        )
        conn.execute(
            "CREATE INDEX IF NOT EXISTS idx_trans_region ON fact_transactions(region);"
        )
    conn.close()
    print("[+] Load complete")

def daily_region_summary(df: pd.DataFrame) -> pd.DataFrame:
    framed = df.copy()
    framed["day"] = framed["timestamp"].dt.date
    return (
        framed.groupby(["day", "region"], as_index=False)["amount"]
        .sum()
        .sort_values(["day", "region"])
    )

if __name__ == "__main__":
    raw = Path("branch_transactions_raw.csv")
    db = Path("branch_analytics.db")
    clean = transform_data(extract_data(raw))
    load_data(clean, db)
    print(daily_region_summary(clean).head(10))
DataFrame.to_sql is documented with the other I/O writers in the pandas I/O guide linked above. Indexes are ordinary SQLite DDL; they make day and region filters snappy when the file grows from twelve rows to twelve thousand.
How I mark student pipelines at MUBS
A script that “runs” is not enough. I look for:
Explicit type coercion and a printed before/after row count.
Idempotent load behaviour you can explain (
replaceversusappend).A summary table a manager could paste into email.
Notes on what you refused to guess (for example, dropping bad dates instead of inventing them).
Those habits transfer to consulting. Clients forgive slow code more than silent wrong totals.
Common failures I see in Kampala data drops
Excel-as-CSV surprises: sep issues, merged header rows, hidden characters. Open the file in a text editor once.
Timezone naivety: branch systems without timezone stamps. Document the assumption (Africa/Kampala) in the README.
Currency text: strip codes and thousands separators before
to_numeric.Duplicate business keys: decide whether the second export wins or whether you keep the first. Write the rule down.
Loading then charting dirty data: never skip the transform printouts.
Stretch goals after the first win
Once the SACCO sample works:
Read a second branch file and
concatframes before transform.Add a simple data quality report: null counts per column.
Schedule the script with cron on a Linux VM.
Feed a clean table into a classical ML baseline later; see the practical ML roadmap.
If Python itself is still new, stabilise syntax first with the Python first-language guide. Pipelines sit on top of calm fundamentals.
Validating the load like a consultant
After to_sql returns, I treat the database as hostile until proven. Open a second connection and ask questions a finance lead would ask:
import sqlite3
conn = sqlite3.connect("branch_analytics.db")
for row in conn.execute(
    """
    SELECT region, COUNT(*) AS n, ROUND(SUM(amount), 2) AS total
    FROM fact_transactions
    GROUP BY region
    ORDER BY total DESC
    """
):
    print(row)
conn.close()
Compare those totals to a manual sum on a ten-row subset. If they disagree, stop charting. In consulting work around Kampala I have seen beautiful dashboards built on a transform that dropped an entire branch because of a silent datetime parse failure. The print of raw versus clean counts earlier is your seatbelt.
Also keep a run_log.txt append for each pipeline run: timestamp, source filename, raw count, clean count, and your git commit hash if you use version control. When a board figure is challenged three weeks later, that log is how you defend the number.
Teaching the pipeline in a shared MUBS lab
Shared PCs complicate installs. My workaround for BBC groups:
Prefer a user-level virtual environment in the home directory when policy allows.
If installs are locked, use a portable USB with WinPython or a prepared offline wheel cache.
Keep sample CSVs tiny so demos survive slow disks.
Export the final SQLite file to the student’s flash drive as the takeaway artefact.
Nkumba labs face the same constraints. The pedagogy stays identical: separate functions, visible counts, query the database by hand. Students who only watch a notebook “Run All” rarely survive a live data drop from a supervisor.
Same-day takeaway
Ninety focused minutes:
Create twelve messy CSV rows by hand reflecting UGX amounts and mixed dates.
Implement extract, transform, load as separate functions.
Print raw count, clean count, and a region summary.
Open
branch_analytics.dbwith the sqlite3 CLI and runSELECT region, SUM(amount) FROM fact_transactions GROUP BY region;Write five lines in your lab book: one rule you enforced, one row you dropped, and why.
That is a portfolio artefact you can show in Ntinda interviews. Not a neural network. A trustworthy table. Boards and supervisors notice the difference.